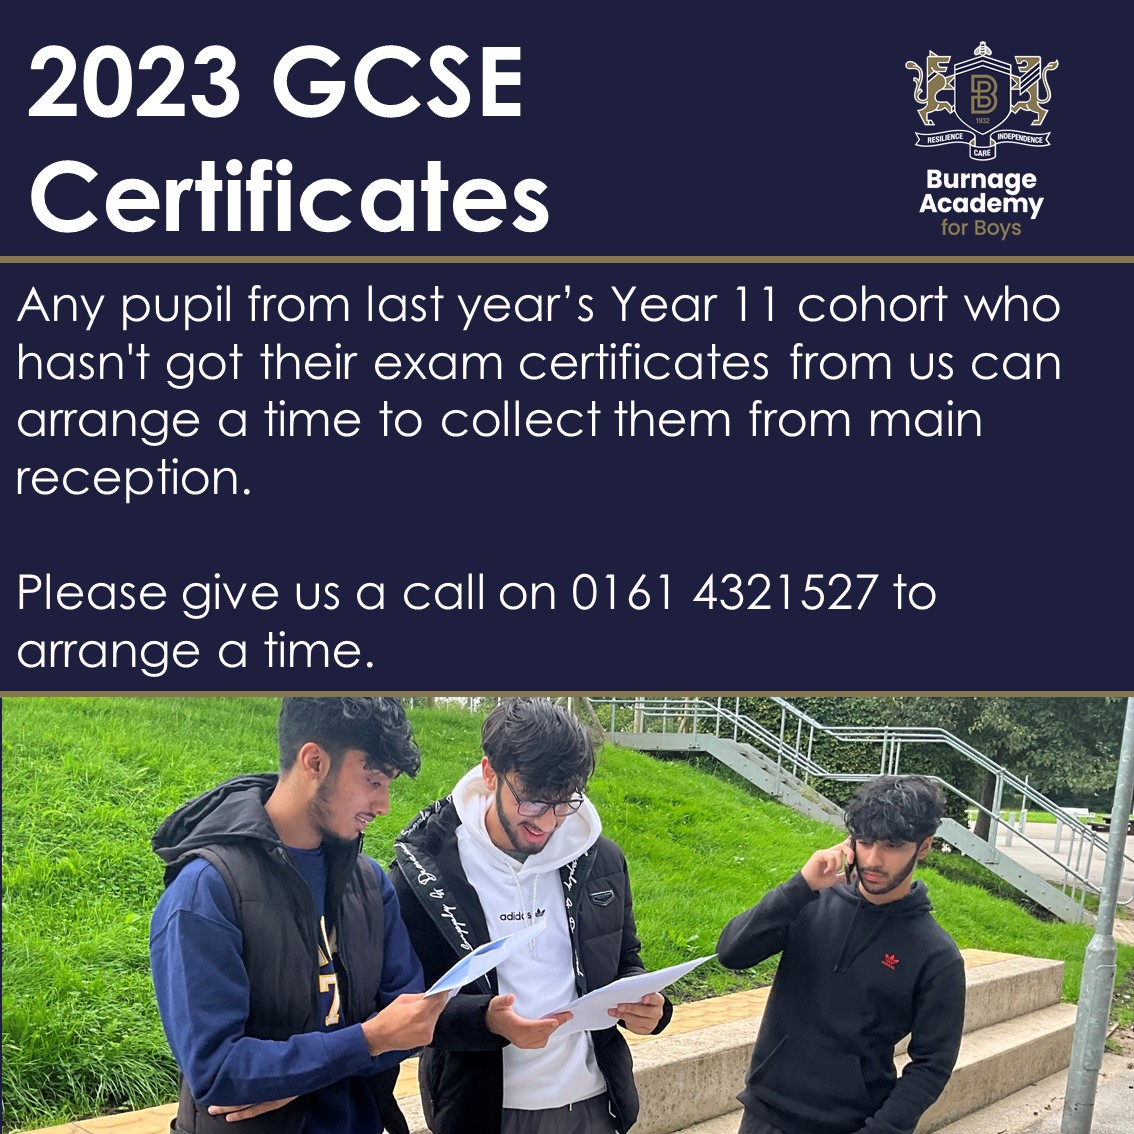
Exams Information
Welcome to Burnage Academy for Boys
At Burnage Academy for Boys, our pupils come first and thrive through our values of resilience, independence and care. Boys here do better, making more progress than they would at any other school in the North of England, with performance in English and Maths amongst the top 1% in the country. We've a range of opportunities for our pupils to develop both in class and through extra-curricular activities. We believe that young people should be prepared for success in life beyond Burnage, to make the best decisions for themselves, and to understand the world in which they live. Welcome to our school!
Stay Informed Latest News


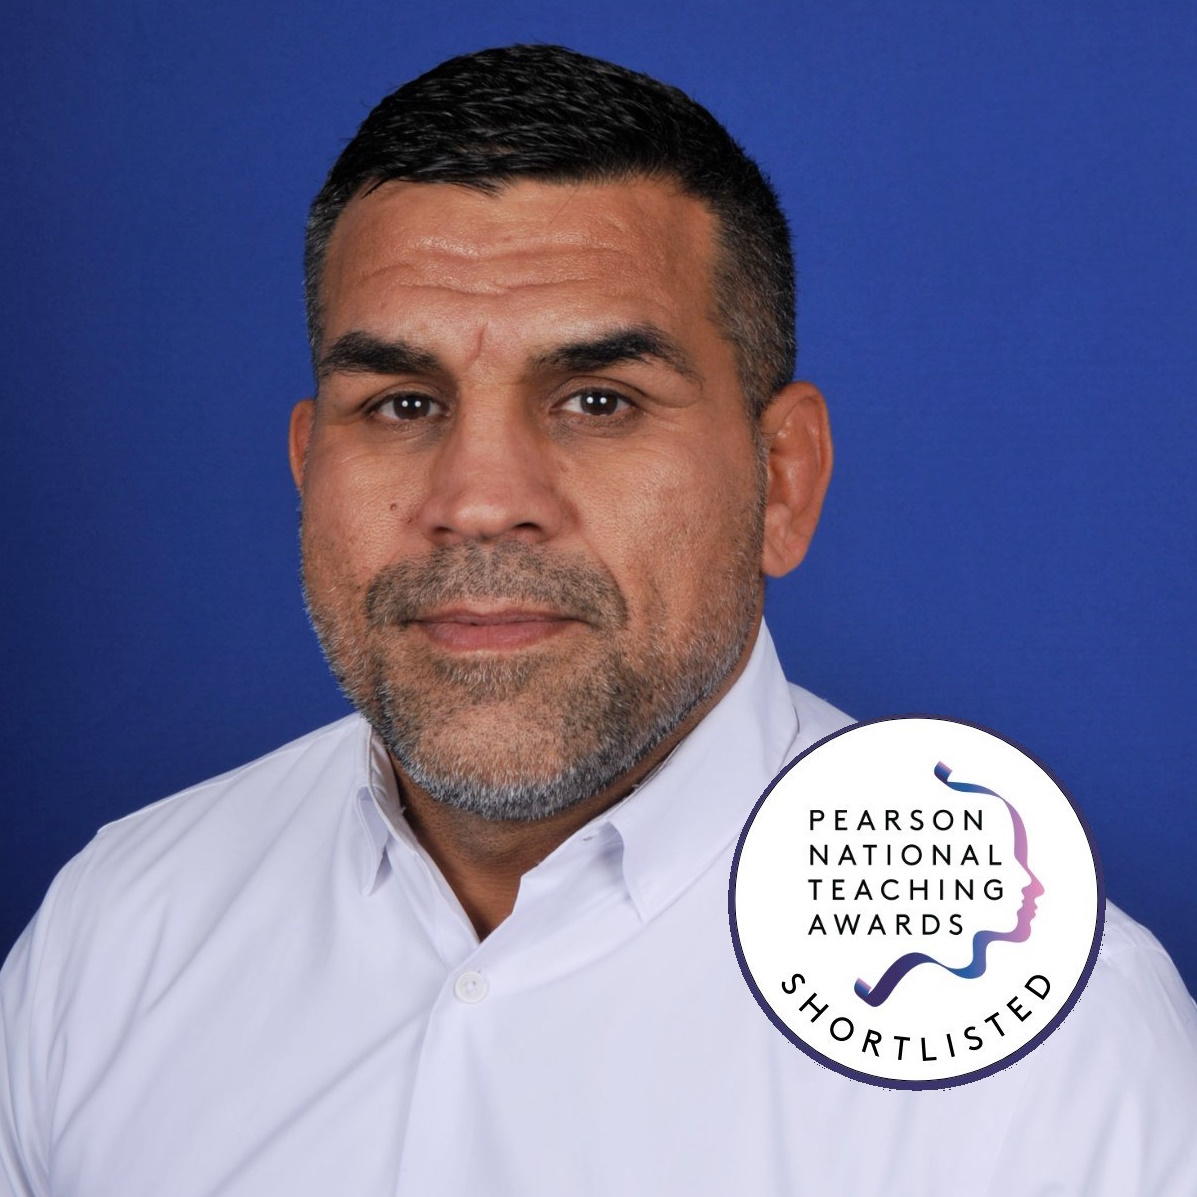
Mo has been shortlisted as a Finalist in the 'Unsung Hero' category in The Pearson @teachingawards 2024!We all know just how much Mo does for our community through mentoring, support for pupils & staff, & through @bcwc2022 too - why not show your support below?Good luck Mo! pic.twitter.com/jk98el8EDK— Burnage Academy for Boys (@Burnage_Academy) April 26, 2024
Twitter • @Burnage_Academy • 26 Apr

We're looking to appoint a Teacher of Mathematics for Sept 2024, with MPS/UPS applications considered. Join our team where teacher wellbeing is at the heart of all we do and outcomes are exceptional.Applications close Weds 1 May, 9am. Details here: https://t.co/wKztNKj3VP pic.twitter.com/B7SpuwChBS— Burnage Academy for Boys (@Burnage_Academy) April 25, 2024
Twitter • @Burnage_Academy • 25 Apr
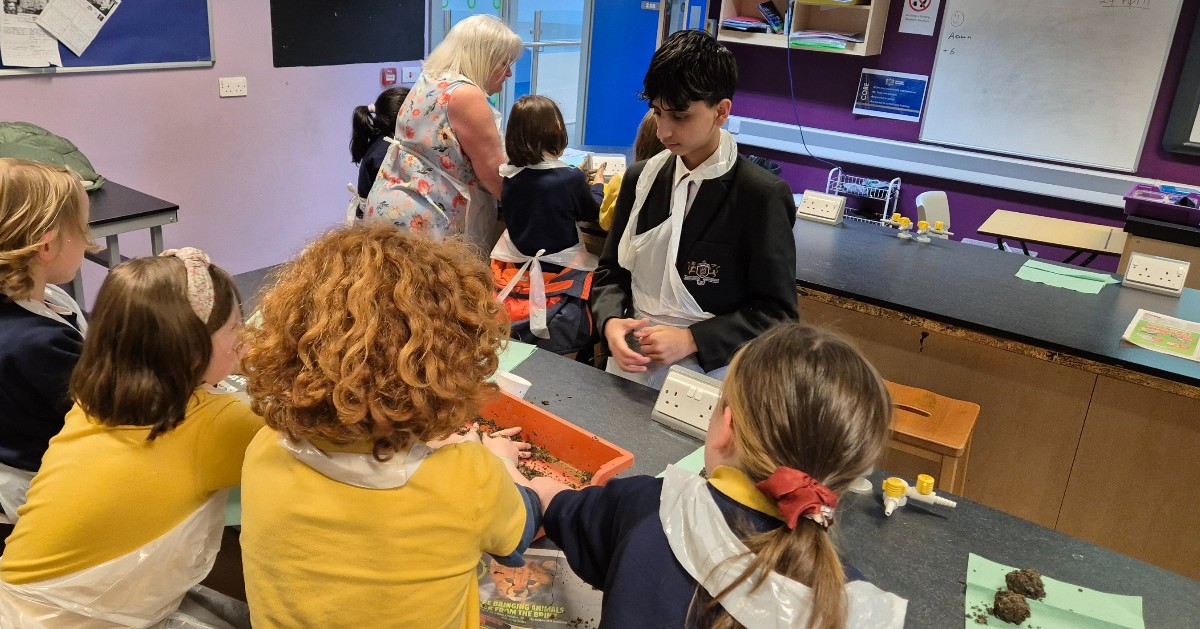
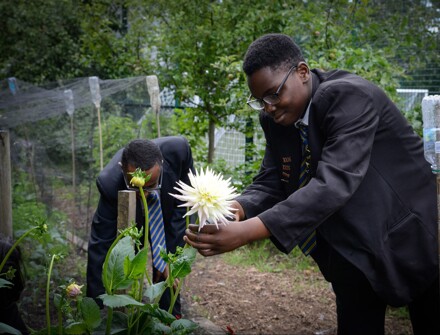
🌎 To mark #EarthDay2024, Planet Protectors from @acaciascps spent a lesson in our science lab making seed bombs to support their new bio strip. They were joined by our two climate club founders Ahmed and Faizan too! pic.twitter.com/hXa9QmZiEJ— Burnage Academy for Boys (@Burnage_Academy) April 25, 2024
Twitter • @Burnage_Academy • 25 Apr
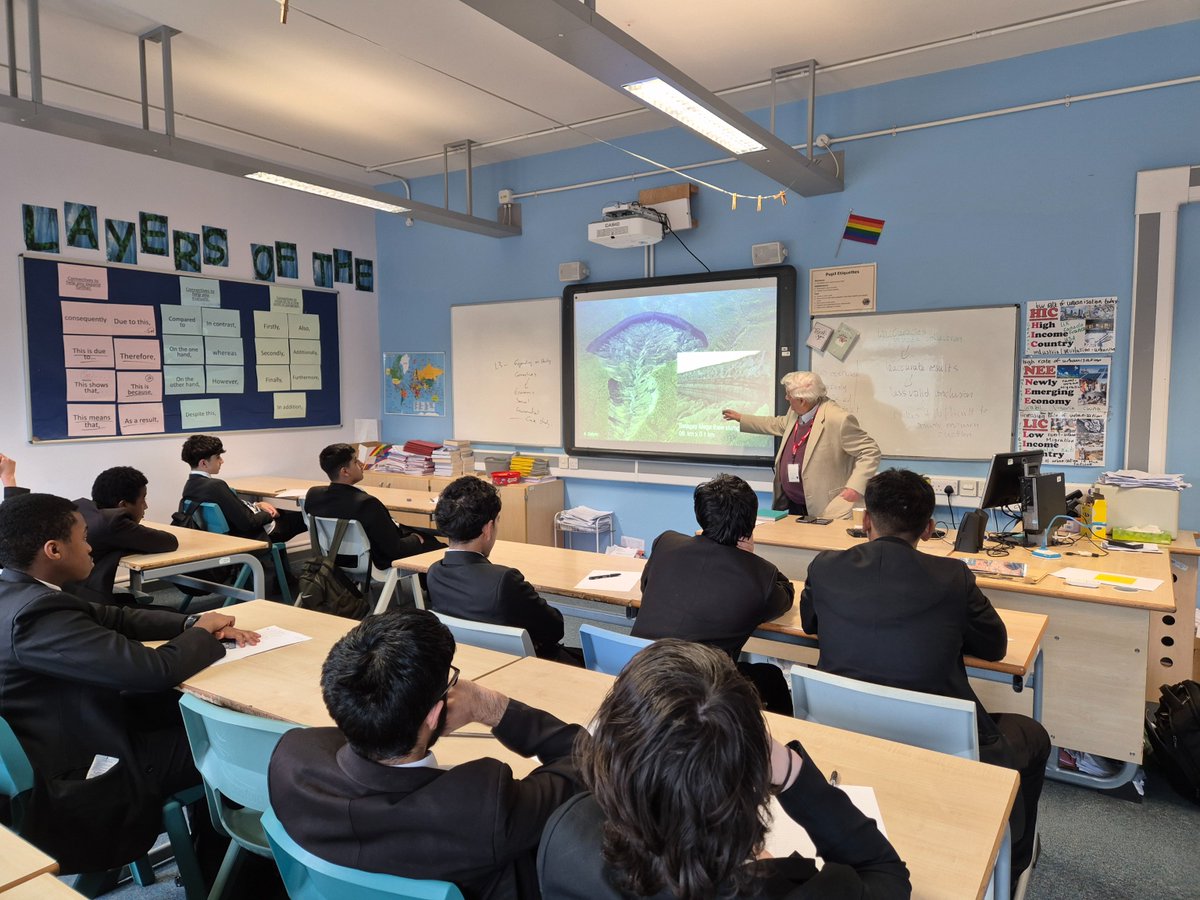
🌎 Yr10 Geography pupils were lucky enough to listen to former pupil and renowned Professor Terry Callaghan, who spoke about his work in the Arctic focusing on #climatechange. It is not often that you hear from a Nobel-Prize winner - especially one who started at Burnage! pic.twitter.com/XCZ4pu7VPE— Burnage Academy for Boys (@Burnage_Academy) April 25, 2024
Twitter • @Burnage_Academy • 25 Apr
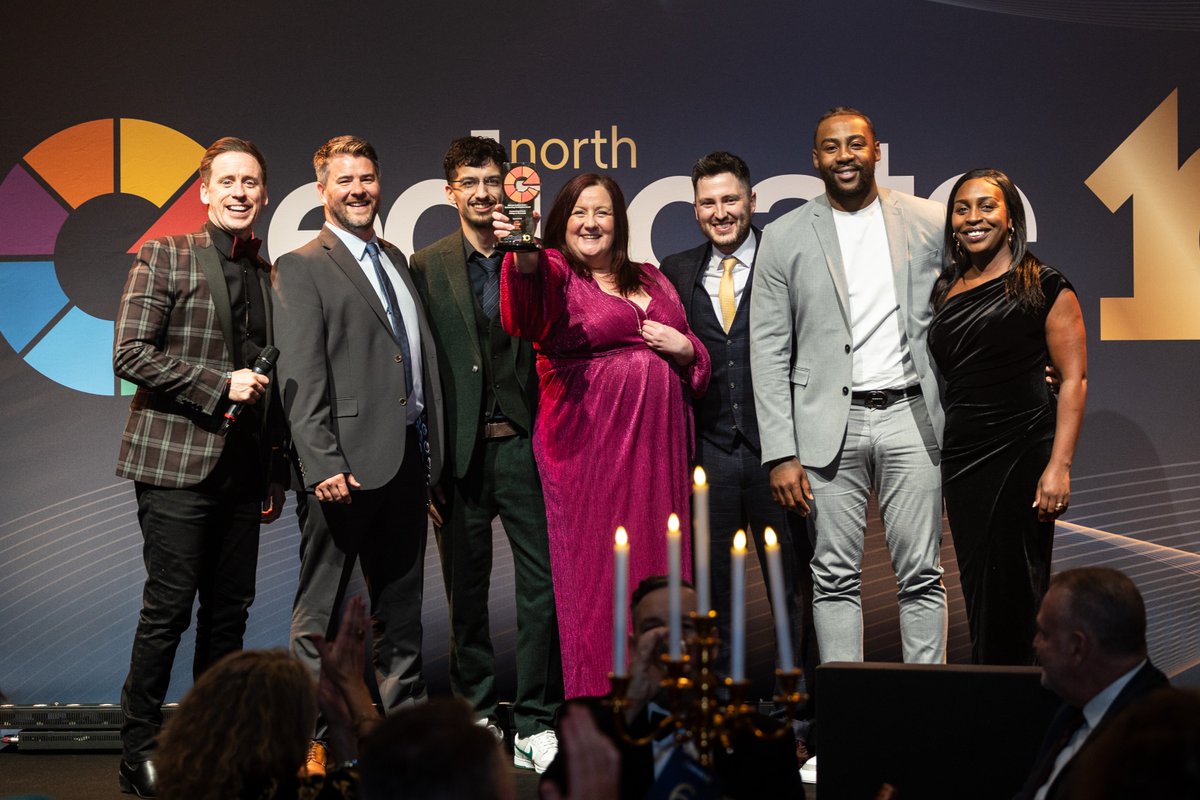
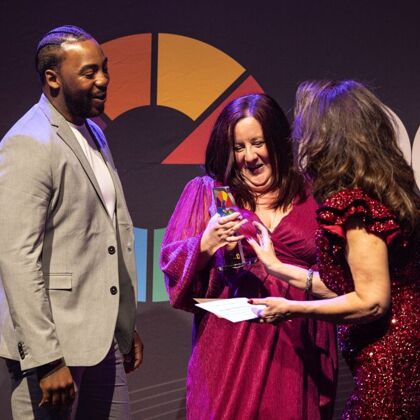
We are delighted to confirm that we have won both the Mental Health and Wellbeing Award, and the Outstanding Contribution Award for an Outstanding School, College or University at the @educatenorth awards! #ENA2024Read more: https://t.co/GZSSo1FPi8 pic.twitter.com/Af5rHcApJb— Burnage Academy for Boys (@Burnage_Academy) April 24, 2024
Twitter • @Burnage_Academy • 24 Apr
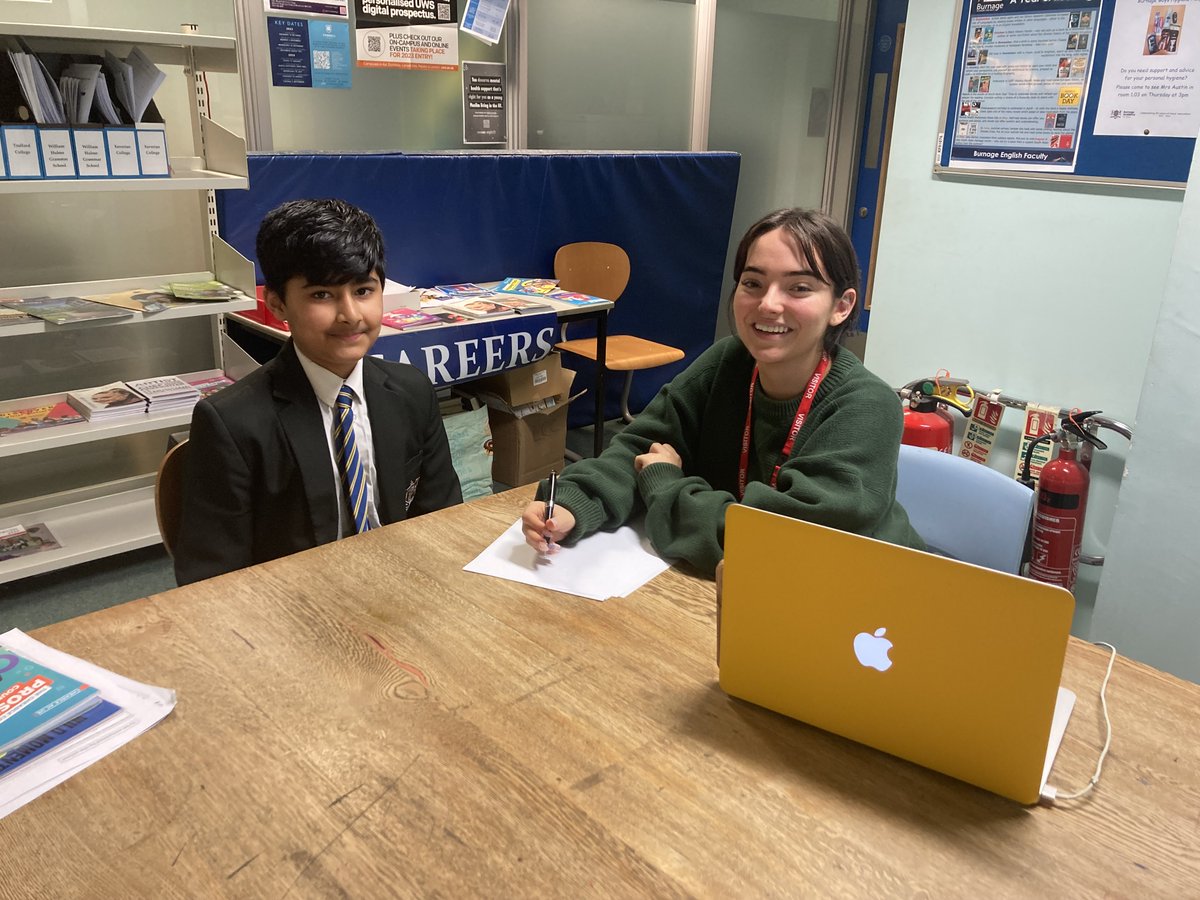
Many of our Year 7s have been talking poetry with creative writing undergraduates from @UoMCreativeMCR. 50 meetings over three days!We'd like to say a HUGE thank you for all of the wonderfully inspiring advice you have given our pupils. @McrCityofLit @newwritingMCR pic.twitter.com/yj7PfRVQ1E— Burnage Academy for Boys (@Burnage_Academy) April 22, 2024
Twitter • @Burnage_Academy • 22 Apr

Thank you to Kate from @UoMSALC @UoMLanguages for running the LanguagesXP programme - pupils in Year 8 had the chance to learn some Portuguese and get an insight into studying languages at university!@UoMSchools pic.twitter.com/EPT4N7svLB— Burnage Academy for Boys (@Burnage_Academy) April 15, 2024
Twitter • @Burnage_Academy • 15 Apr
The Spring edition of our newsletter, The Burnage Academy Bulletin, is out! Featuring:✔️ Outstanding @ofstednews report🐝 @LordMayorOfMcr Visit🎖️ Nominations for @educatenorth Awards🇫🇷 Year 11 @TuringScheme_UK visit to France...and more!Click here: https://t.co/bxNtStdUxV pic.twitter.com/hZOdk1oD8w— Burnage Academy for Boys (@Burnage_Academy) March 28, 2024
Twitter • @Burnage_Academy • 28 Mar
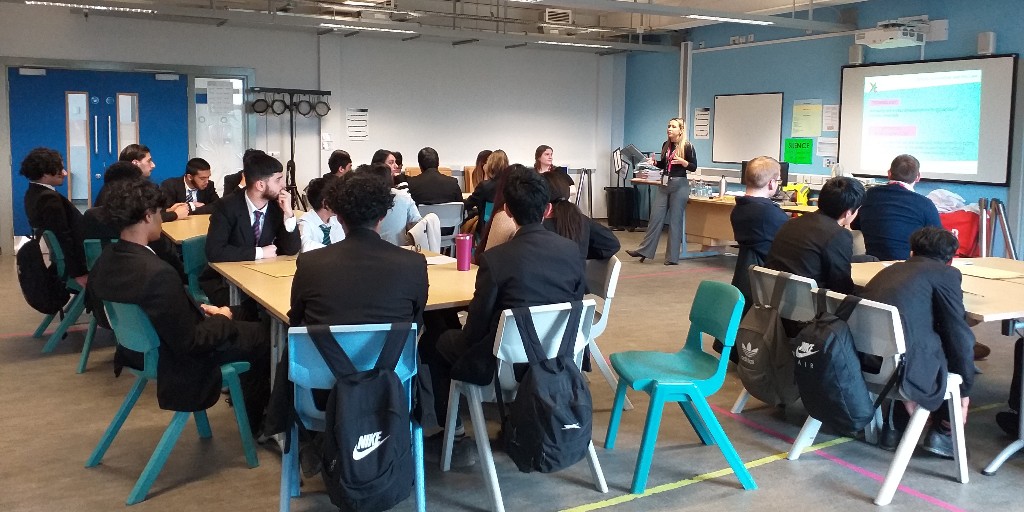
Thank you to @YoungCitizensUK and @CMS_Law for working with Yr10 Business Studies students about Ethics, Innovation and the Law. The session included discussions on technology and the differences between what is legally possible and what is ethically acceptable. pic.twitter.com/mTFjIUtmcZ— Burnage Academy for Boys (@Burnage_Academy) March 27, 2024
Twitter • @Burnage_Academy • 27 Mar
A thread - a message from Emine, Yr8:"This is my brother Noah. Some of you might know him as a friend or classmate but I know him as the strongest little guy I have ever met.He never gives up and fights through all the obstacles in life with having Crohn’s from a young age... pic.twitter.com/Dj6eYeHeOJ— Burnage Academy for Boys (@Burnage_Academy) March 27, 2024
Twitter • @Burnage_Academy • 27 Mar